Observability

Monitoring chatlas apps with OpenTelemetry

Shipping raises new questions

  • So your chatbot works for you, but are you sure it’s working correctly in production?
  • Even if you test extensively, users may encounter undiscovered issues.
  • Collecting telemetry data from your app in production helps you answer questions like:
    • Are users encountering errors?
    • Is the LLM performing as expected?
    • What are users asking?
  • OpenTelemetry (OTel) is an open standard collecting information about your app’s behavior.

OpenTelemetry, briefly

  • A vendor-neutral, open standard for collecting traces, metrics, and logs from an app.
  • Instrument once, view anywhere – Logfire, Datadog, etc. all speak OTel.
  • chatlas is instrumented with OTel out of the box – no tracing code to write yourself, just choose where to send the data.
  • That said, you can also add your own spans to capture additional information about your app’s behavior
    • e.g., tool execution, database queries, etc.
  • Shiny is also instrumented with OTel, so you can see the full picture of your app’s behavior.

Two concepts: span & trace

  • A span is one timed unit of work – one model call, one tool execution – with a name and key/value attributes.
  • A trace is a tree of spans: the full path of one request, each nested under the one that triggered it.

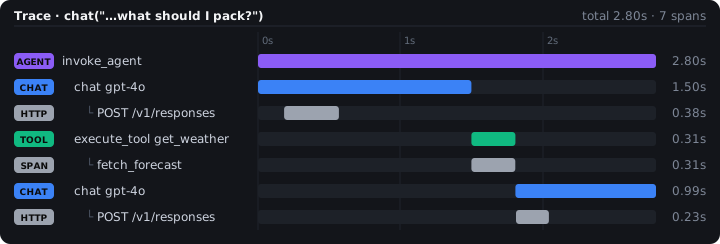
A single chat() that calls a tool produces a trace shaped like this:

invoke_agent                      # wraps the full chat loop
├── chat gpt-4o                   # each model API call
├── execute_tool get_weather      # each tool invocation
├── chat gpt-4o                   # follow-up model call
└── ...

Quick start: console output

Emit traces to the console:

otel_config.py
from opentelemetry import trace
from opentelemetry.sdk.trace import TracerProvider
from opentelemetry.sdk.trace.export import ConsoleSpanExporter, SimpleSpanProcessor

provider = TracerProvider()
provider.add_span_processor(SimpleSpanProcessor(ConsoleSpanExporter()))
trace.set_tracer_provider(provider)


app.py
import otel_config 
import chatlas as ctl

chat = ctl.ChatBedrockAnthropic()
chat.app()

Visualize traces

A service like Logfire is free to start and provide a nice UI for viewing traces.

pip install logfire
logfire auth

Add this to your app:

app.py
import logfire
logfire.configure()

Or, the more generic OTel env vars works with many backends…

OTEL_EXPORTER_OTLP_ENDPOINT="https://logfire-eu.pydantic.dev"
OTEL_EXPORTER_OTLP_HEADERS="Authorization=<your-write-token>"
OTEL_SERVICE_NAME="my-chatlas-app"

…also nice you don’t need to touch app code ^

Visualize traces

  • Read top to bottom: the model decides to call the tool (blue), the tool runs (green), and a follow-up model call answers (blue).
  • Here there is also custom instrumentation for HTTP traffic as well as the tool call (gray).

Example: custom spans

from opentelemetry import trace
from opentelemetry.instrumentation.httpx import HTTPXClientInstrumentor
from chatlas import ChatBedrockAnthropic

HTTPXClientInstrumentor().instrument()  # nests the HTTP call under `chat`
tracer = trace.get_tracer("travel_assistant")

def get_weather(city: str) -> str:
    with tracer.start_as_current_span("fetch_forecast"):
        return f"{city}: 14°C, light rain, breezy this weekend."

chat = ChatBedrockAnthropic()
chat.register_tool(get_weather)
chat.chat("I'm headed to Tokyo this weekend — what should I pack?")

What’s captured

Span Captures
invoke_agent – the whole chat loop Provider, requested model
chat – one per model call Provider/model, token usage, response id
execute_tool – one per tool call Tool name, description, call id, errors
  • Since message content may contain sensitive data, it is not captured by default. You can opt-in to capture it if you want.
OTEL_INSTRUMENTATION_GENAI_CAPTURE_MESSAGE_CONTENT=true

Going deeper (optional)

chatlas’s spans describe the shape of a conversation. To see inside each step – raw HTTP, retries, full payloads – add a lower-level instrumentor:

Level Example Tradeoff
Transport httpx instrumentation Works with every provider; generic HTTP spans only
SDK, model-agnostic OpenLLMetry GenAI-aware spans across many providers
Official, per-provider e.g. opentelemetry-instrumentation-anthropic Most detail; one package per SDK
  • Start with httpx (you just saw it) – reach for the others only if you need GenAI-specific attributes chatlas doesn’t already give you.

Exercise

  • Add otel_config.py (the console version above) to your exercises/ folder, then add import otel_config as the very first line of shinychat-app.py.
  • Chat with it and watch spans print in your terminal.
  • Bonus: wrap get_weather() in a custom span, like the travel_assistant example.

>}}